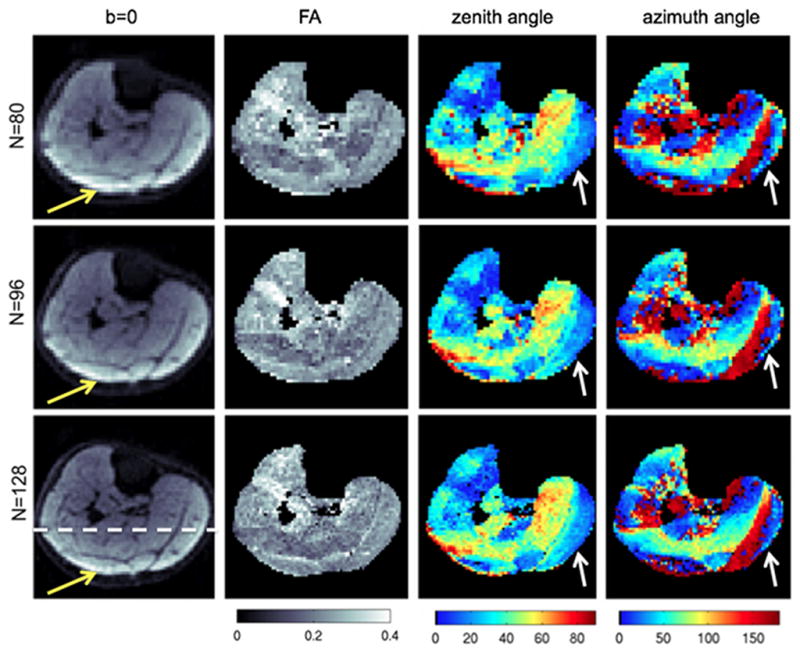
Figure 10.

Partial volume effects on DTI maps on a middle calf slice of subject A. The first column shows the b=0 images, the second column shows the FA maps, the third column shows the zenith angle of the primary eigenvector, and the fourth column shows the azimuth angle of the primary eigenvector at three different acquisition matrices: N=80 (first row), N=96 (second row), and N=128 (third row). The white arrows point to the medial gastrocnemius region and the yellow arrows point to the region affected by the olefinic fat chemical shift artifact.
