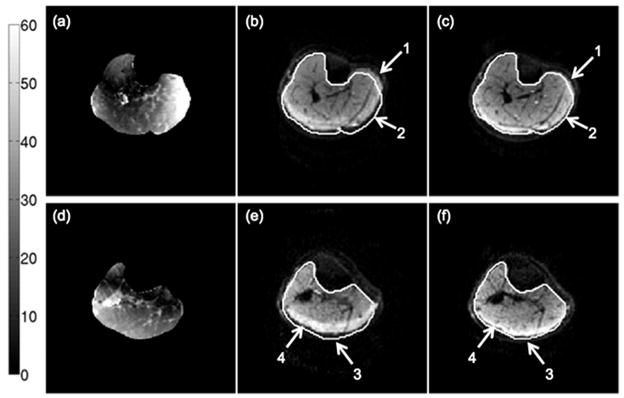
Figure 6.
Effect of B0-induced distortions on a middle calf slice (a–c) and a proximal calf slice (d–f) of subject A: (a,d) absolute fieldmap images, (b,e) b=0 images with the N=128 acquisition matrix and R=1.33, and (c,f) b=0 images with the N=128 acquisition matrix and R=2.86. The white line corresponds to the contour of the muscle drawn based on the FSE T2-weighted scan. The colorbar corresponds to the fieldmap values in Hz. The arrows 1, 2 and 3 point to regions affected by severe geometric distortions and the arrow 4 points to a region affected by the olefinic fat chemical shift artifact.

