
Figure 9.
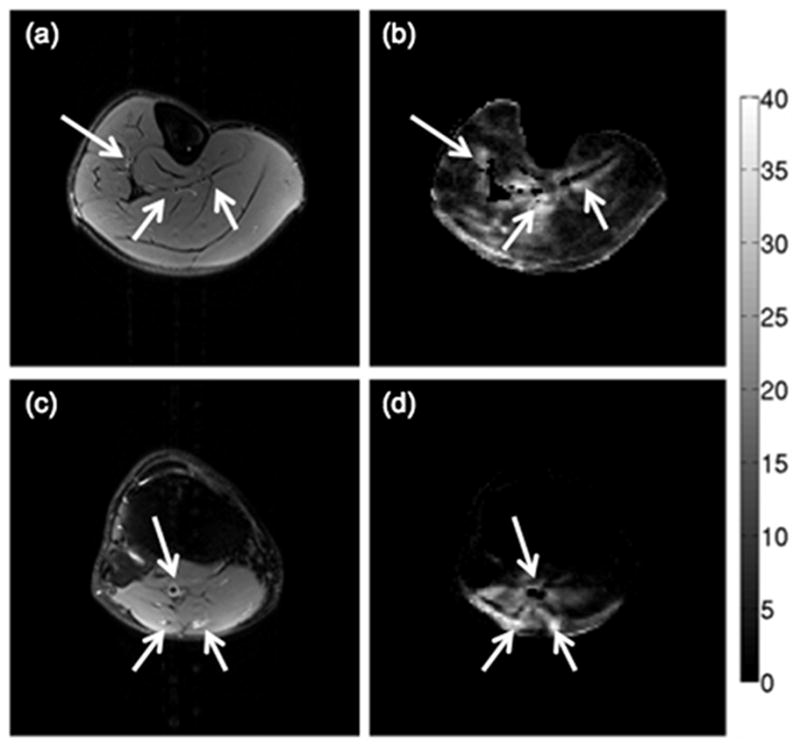
Regions with high percentage of outliers identified by the RESTORE algorithm for a middle calf slice (a–b) and a proximal calf slice (c–d) of subject B: (a,c) T2-weighted FSE images, and (b,d) maps of the percentage of data points identified as outliers by the RESTORE algorithm. The colorbar corresponds to the percentage of data points identified as outliers. The arrows point to vessels identified from the T2-weighted FSE images.