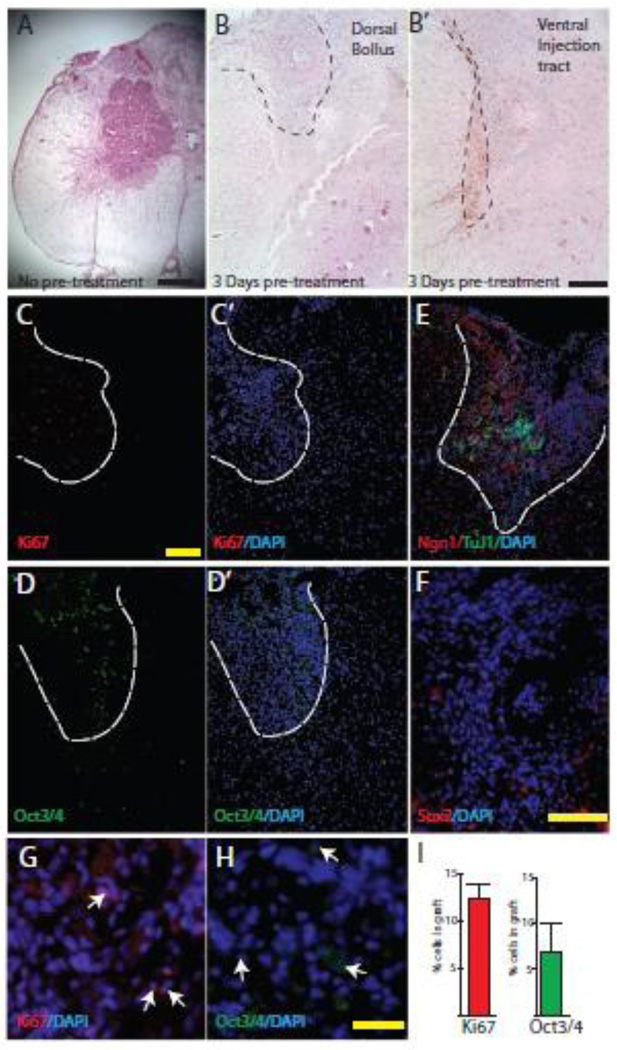
Figure 5. Examination of stem cell phenotype after spinal implantation of N7 cells.
Spinal cord cross sections from animals after intraspinal injection of N7 mES cells A–B. H&E staining of spinal cords without Dox pretreatment of N7 cells (A) or with Dox pretreatment (B). Scale bar 400 µm (A), 200 µm (B’). C–H. IHC staining of spinal cord cross sections injected with primed N7 cells for proliferation marker Ki67 (C; inset shows number of Ki67 cells per graft) and stem cell marker Oct 3/4 (D; inset shows number of Oct3/4 cells per graft) Scale bar 200 µm. G,H Higher power image of Ki67 and Oct3/4 staining, positive cells labeled with white arrows, scale bar 50 µm. E. Double labeling Ngn1 (red) and, Tuj1 (green) to identify graft area. F. No Sox2 positive cells within the graft area, but some in host tissue, scale bar 100 µm.

