
Fig. 2.
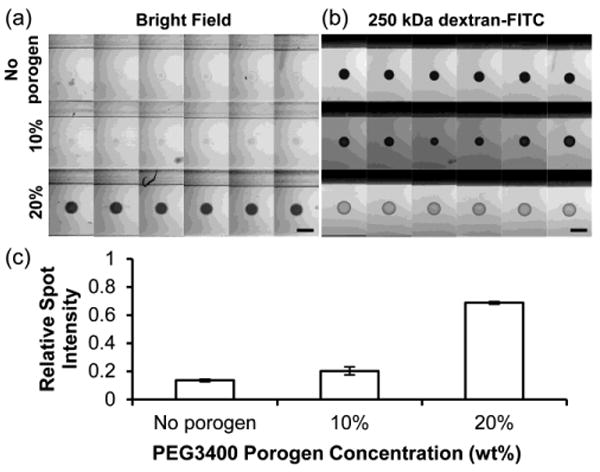
Diffusion of 250kDa dextran-FITC in 5% PEG700DA hydrogels with 0–20% PEG3400 porogen. (a) Bright field image montage of hydrogel pillars (contrast enhanced). (b) Fluorescence microscopy image montage of pillars incubated in 250 kDa dextran-FITC after 4 h. Each row displays six replicate pillars. Scale bars represent 500 μm. (c) Values for spot intensities from images in (a). Relative spot intensity is the ratio of the average gray value (AGV) of the spot with background (AGV outside channels) subtracted to the AGV in an area surrounding the spot with background subtracted. Error bars = SD (n = 6 pillars); P < 0.05 between all pairs.