
Fig. 7.
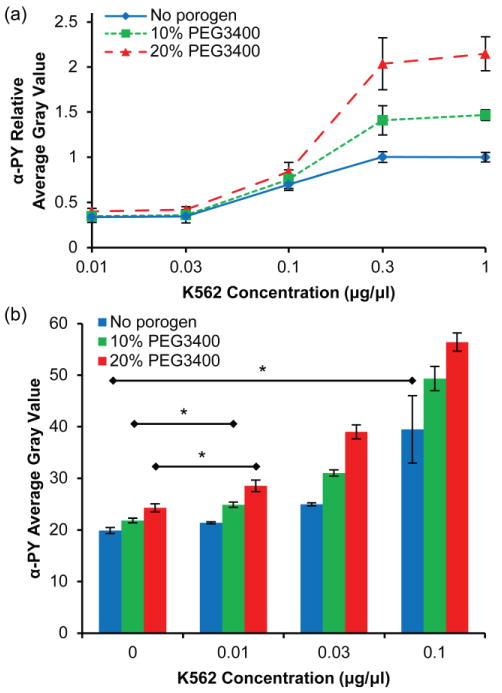
Effect of porogen concentration on detection sensitivity of the microchannel kinase assay. (a) Relative anti-phosphotyrosine signal (exposure time = 2 s) as a function of K562 cell lysate dilution for PEG hydrogels with 20% PEG3400 (▴), 10% PEG3400 (▪) and without porogen (◆). Data are relative to the maximum average gray value for the hydrogel formed without porogen. Error bars = SE (n > 6 experiments). (b) Average gray value of anti-phosphotyrosine signal (exposure time = 5 s) for hydrogels with and without porogen at low K562 concentrations. Error bars = SD (n > 3 spots). * P < 0.05 indicates limit of quantitation for each hydrogel.