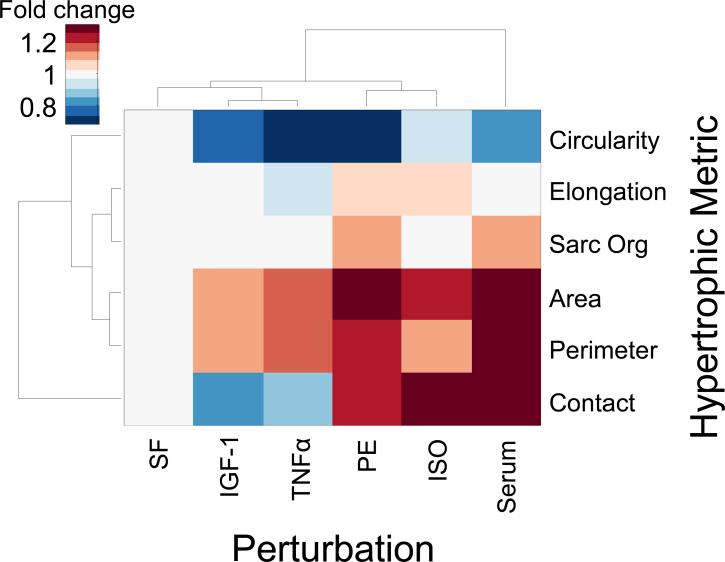
Figure 9. Hypertrophic agonists cause distinct forms of myocyte hypertrophy.
Effects of ISO, PE, TNFα, IGF-1 and serum are plotted against median changes in myocyte phenotype metrics quantified by automated segmentation. Phenotype metrics are cell area, perimeter, elongation, circularity, sarcomeric organization, and cell-cell contact. Hypertrophic agonists and phenotype metrics were grouped by hierarchical clustering. While all agonists increased cell area, they had qualitatively different effects on elongation, sarcomeric organization, and cell-cell contact.

