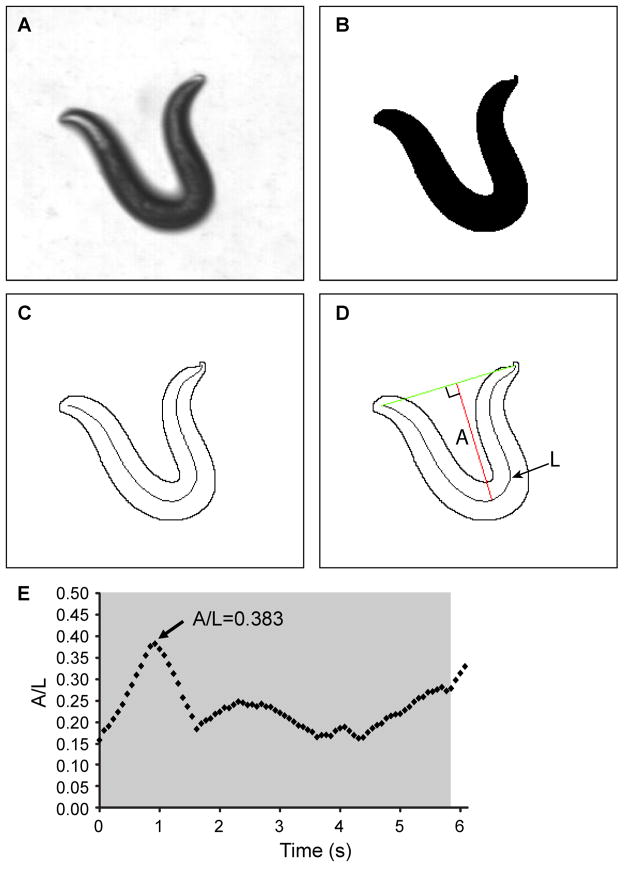
Figure 2.
Measurement of the amplitude to length ratio in a reversal. (A) Frame from video showing deep bend of an N2 nematode in a reversal. (B) Binary image of the frame from (A). (C) Outline of the animal and the corresponding midline spline used to determine the length of the animal. (D) Measurement of the amplitude of the bend was made by measuring the longest perpendicular length, A, from a line connecting the head to the tail to the midline spline, of contour length L. The ratio of this value, A, to the contour length, L, was calculated (A/L). (E) Time course measurement of the A/L values for a single measurement. The tap stimulus was applied shortly before t=0 seconds (s). The grey region indicates the time the animal is in a reversal and it is during this time that the maximum A/L value is measured.

