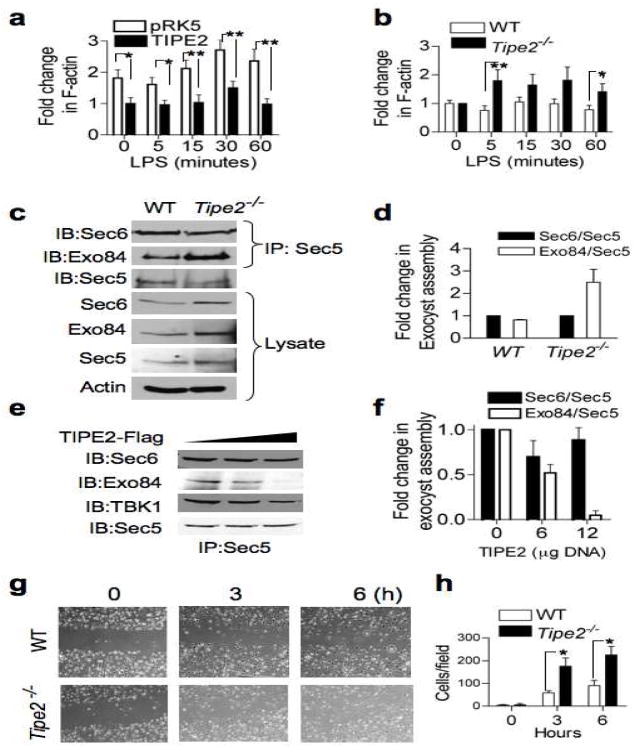
Figure 3. TIPE2 regulates cell migration, exocyst assembly, and actin dynamics.
(a) Decreased rate of F-actin polymerization in TIPE2-expressing Raw 264.7 macrophages. Cells were transfected with either TIPE2 or empty plasmid (pRK5). One day later, the cells were treated with LPS (200 ng/ml) for the indicated times, and F-actin level was measured as described in Methods. The value of the TIPE2 group at time zero was set as 1. Results are means ± S.E.M, and were pooled from three independent experiments (n=12). * p < 0.05; ** p<0.01. (b) Increased polymerization of F-actin in Tipe2−/− splenocytes. Wild type and Tipe2−/− splenocytes were treated with LPS (200 ng/ml) for the indicated times and the F-actin level was measured. The value at time zero was set as 1. Results are means ± S.E.M, and were pooled from three independent experiments (n=6). * p < 0.05; ** p < 0.02. (c–d) Increased exocyst complex assembly in Tipe2−/− bone marrow-derived macrophages. Lysates of wild type and Tipe2−/− cells were immunoprecipitated with anti-Sec5 and subjected to SDS-PAGE and IB (c). Quantitation of the exocyst assembly was performed by densitometry (d). Results are means ± S.E.M of Sec6/Sec5 and Exo84/Sec5 ratios pooled from two independent experiments. The values of Sec6/Sec5 ratio for each group were set as 1. (e–f) Decreased exocyst complexes in TIPE2-expressing cells. Lysates from 293T cells transfected with increasing amounts of TIPE2 plasmid (0, 6, and 12 μg/10-cm plate) for 18 hours were immunoprecipitated and tested as in panel c (e). Quantitation of the exocyst assembly was performed by densitometry (f). Results are means ± S.E.M pooled from two independent experiments. The values of Sec6/Sec5 ratio for each group were set as 1. (g–h) Increased migration of Tipe2−/− macrophages. Confluent monolayers of wild type and Tipe2−/− bone marrow-derived macrophages were subjected to the wound-healing assay as described in Methods. Images were then taken immediately after applying the wound (time 0), and 3 and 6 hours later (g). Cells that migrated into the wounded areas were counted using the ImageJ software. Results are means ± S.E.M of 10 fields from each group, and are representative of three independent experiments. *p < 0.005.

