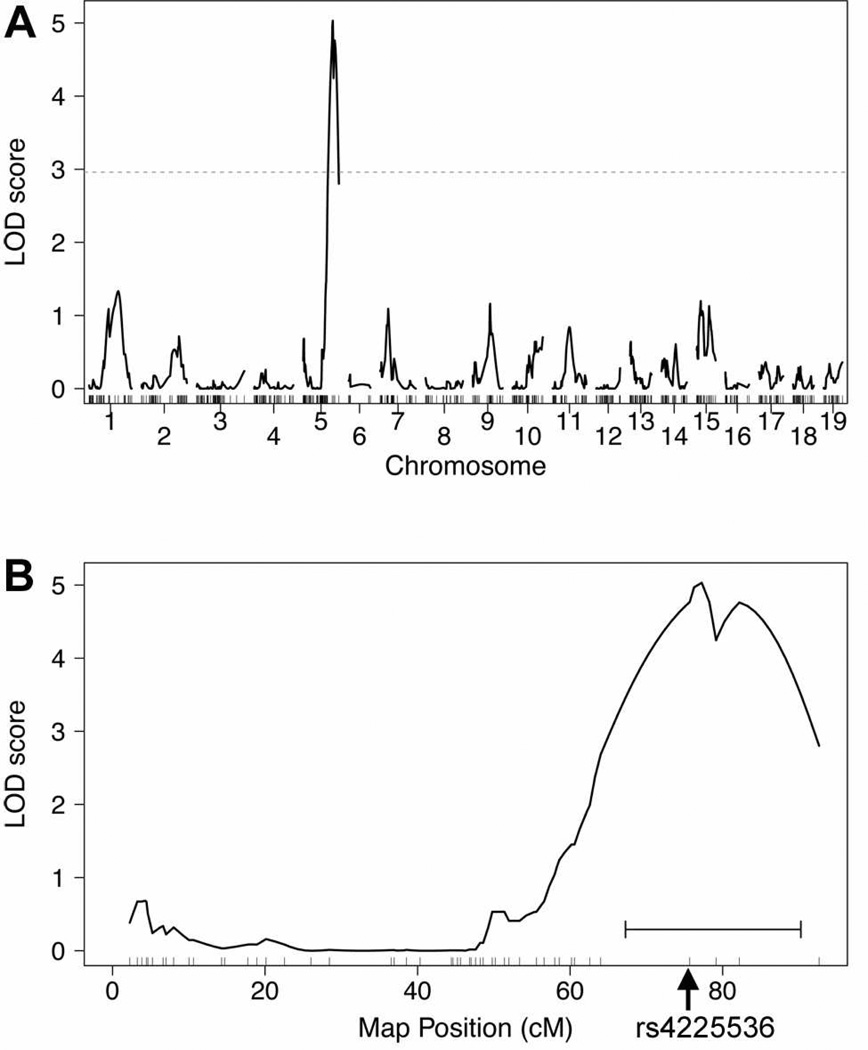
Figure 2.
Binary trait linkage analysis of spinal cord astrocytoma in BC(129XB6)X129)-NPcis mice. Panel A shows the linkage across the genome, with a peak on Chr 5. The dotted line shows the genome-wide significance level of P = 0.05 based on permutation testing. Panel B shows linkage on Chr 5 with the highest peak at 77.26 cM. The horizontal bracket below the peak indicates the 1.5 LOD support interval that defines the Scram1 locus. The rs4225536 marker that was used for subsequent analyses is indicated by the arrow at 75.7 cM.

