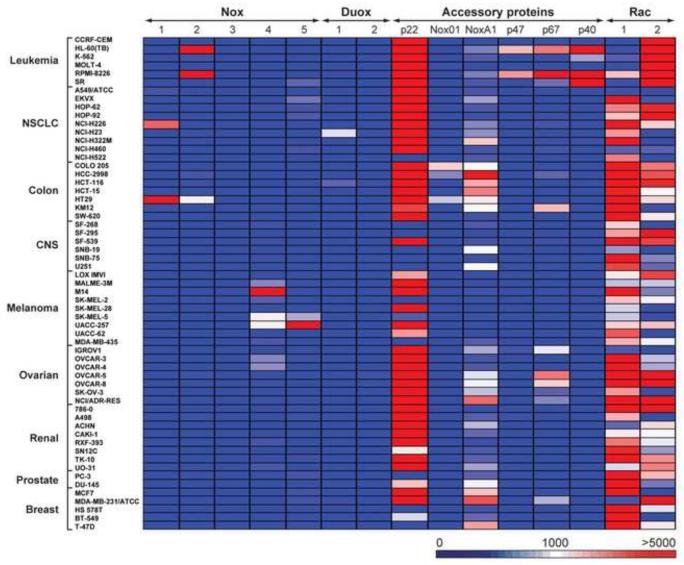
Fig. 4.
Intensity plot of mRNA expression of Nox isoforms and accessory genes in the NCI-60 tumor cell panel relative to 18S rRNA levels. The data represent the relative mRNA expression ratios (from undetectable to > 5000) for all of the cells in the NCI-60 panel; the expression ratios are grouped by disease subpanels (Y axis), and Nox family or accessory gene expression (X axis); the data represent the mean values from a minimum of three experiments.

