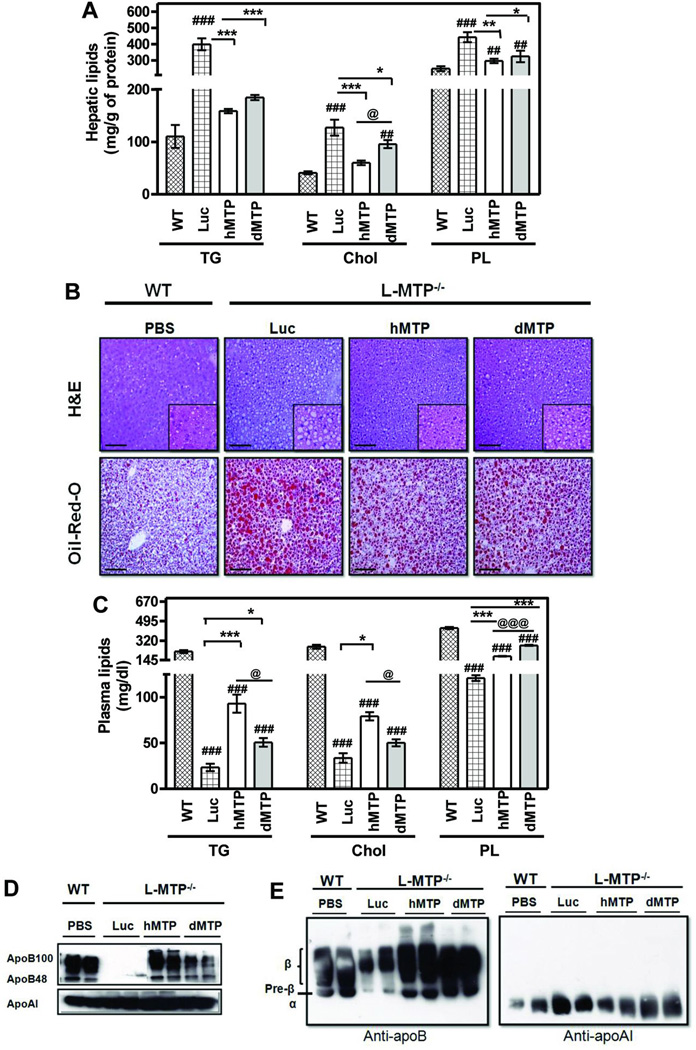
Figure 2. Effects of hMTP and dMTP expression on tissue and plasma lipids in L-MTP−/− mice fed western-diet.
WT mice and L-MTP−/− were fed a western-diet (Harlan Teklad, 42% fat) for 15 days ad libitum. Different adenoviruses (1010 pfu) were transduced into L-MTP−/− mice. WT mice received sterile PBS. Diet was continued for an additional 5 days, fasted (6 h), and plasma and tissues were collected. Mean ± SEM, n=5. ***p < 0. 001, **p < 0. 01, *p < 0. 05. (A) Hepatic lipids showing triglycerides, total cholesterol and phospholipids. (B) Representative images of liver sections from each group stained with H&E showing histology and Oil-Red-O showing lipid content. Bars = 50 µm. (C) Plasma triglyceride, cholesterol, and phospholipids. (D) Plasma samples were separated by SDS-PAGE and immunoblotted for apoB (top) and apoAI (bottom). (E) Agarose gel electrophoresis of plasma samples followed by immunoblot analysis for mouse apoB (left) and apoAI (right).

