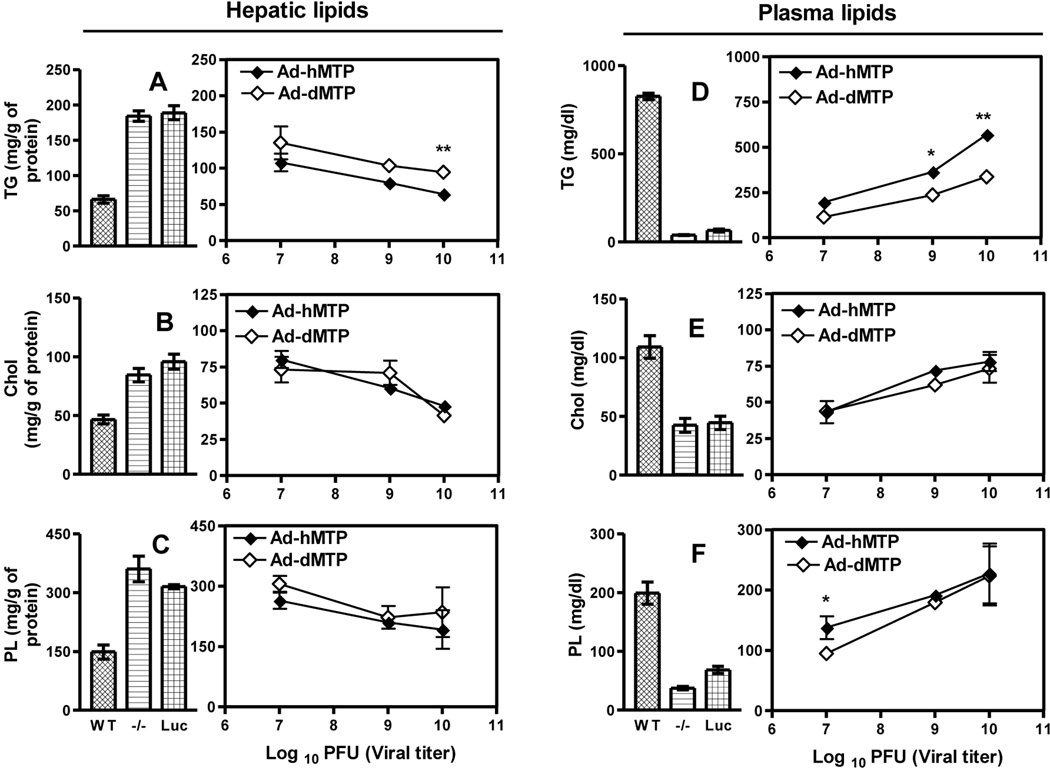
Figure 4. Effect of different levels of MTP ortholog expression on hepatic and plasma lipids.
L-MTP−/− mice were transduced with 107, 109, and1010 pfu of Ad-Luc, Ad-hMTP or Ad-dMTP. After 3 days, mice were fasted (4 h), injected with P407, and plasma was collected after 2 h. Data from WT, L-MTP−/− (−/−) and Ad-Luc (1010 pfu) are shown as bar graphs. Effects of expression of different levels of hMTP and dMTP are shown as line graphs. (A–C) Hepatic triglyceride (A), cholesterol (B), and phospholipid (C). (D–F) Plasma total triglyceride (A), cholesterol (B) and phospholipid (C). Mean ± SEM, n=3. Student’s t-test was performed between hMTP and dMTP groups for each concentration. ***p < 0. 001, **p < 0. 01, *p < 0. 05.

