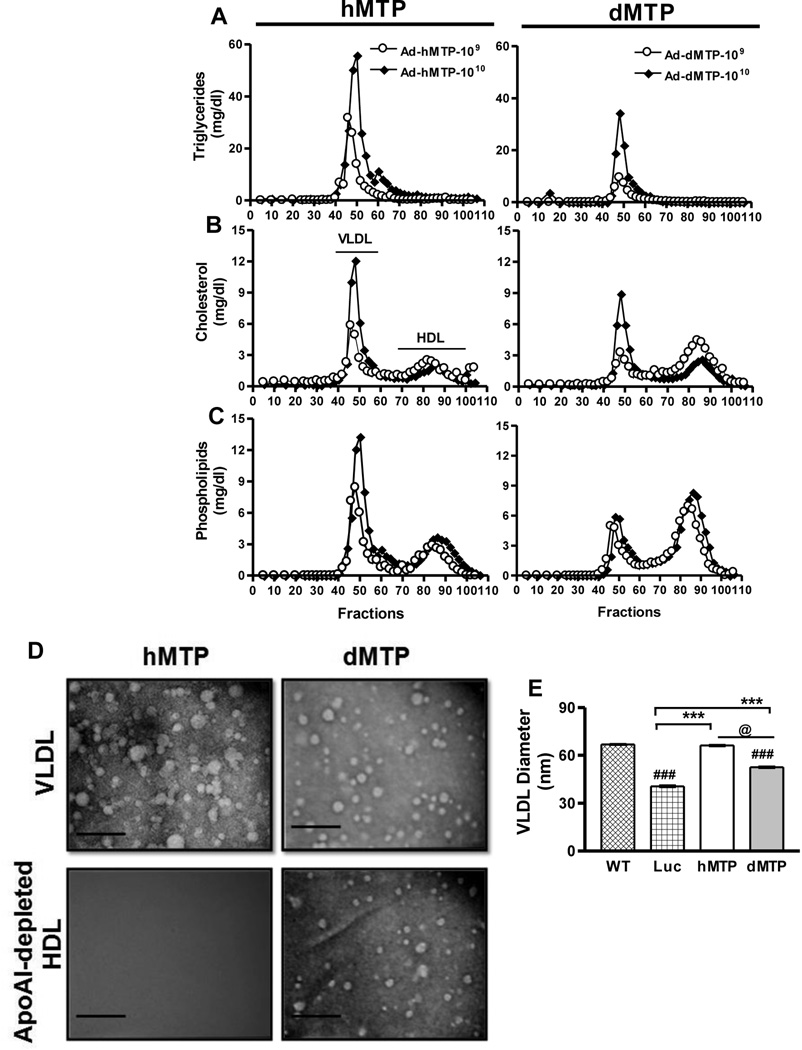
Figure 5. Plasma lipoprotein characterization.
L-MTP−/− mice were transduced with different titers of adenoviruses. After 3 days, mice were fasted (4 h) and injected with P407. Plasma was collected after 2 h, pooled, and subjected to FPLC. Triglyceride (A), cholesterol (B) and phospholipid (C) distribution in plasma lipoproteins of Ad-hMTP (left panel) and Ad-dMTP transduced mice (right panel). (D–E) VLDL fractions after FPLC were pooled and concentrated. Similarly, HDL fractions were pooled and apoAI-lipoproteins were removed by immunoprecipitation. VLDL and ApoAI-free HDL were subjected to negative staining and electron microscopy (D). VLDL Bars = 180 nm, HDL Bars = 72 nm. Average diameter of VLDL particles in different groups (Mean ± SEM, n=200–300) (E). ***p < 0. 001, **p < 0. 01, *p < 0. 05.

