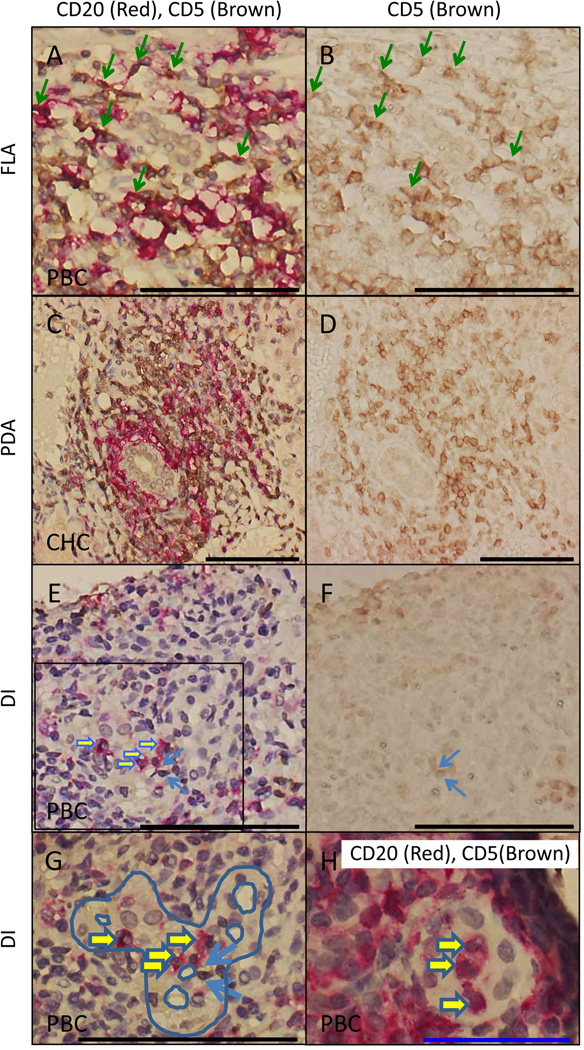
Figure 4.
Representative profiles of portal areas in liver tissues from PBC and CHC patients. Double staining for CD20 (red) and CD5 (brown) within follicle-like aggregates (A), periductal aggregates (C), and ductal invasive CD20+ and CD5+ cells (E). Single staining for the same aggregates as in A, C and E for CD5 (brown) expressing tissues (B, D and F). Damaged bile ducts were marginally highlighted with blue-color trace (G) in a magnified view of panel E. The ductal invasion of CD20 single positive cells was observed in a small bile duct (H). Double positive cells for CD20 and CD5, single positive cells either for CD20 or CD5 are highlighted with green, yellow, or blue arrows respectively. (Blue and black scale bars indicate 50 and 100 µm respectively in A–H.)

