
Fig. 3.
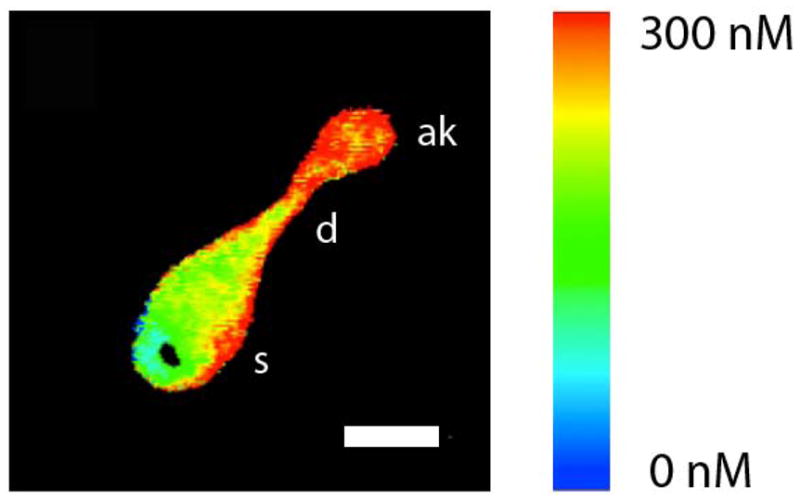
Image of an isolated OSN at the peak of the response to mix B. Pseudocolor shows the estimated intracellular calcium calculated from the fura-2 fluorescence ratio. Calcium increases in apical knob (ak) and dendrite (d). s stands for soma. The white bar is 5 μm long.