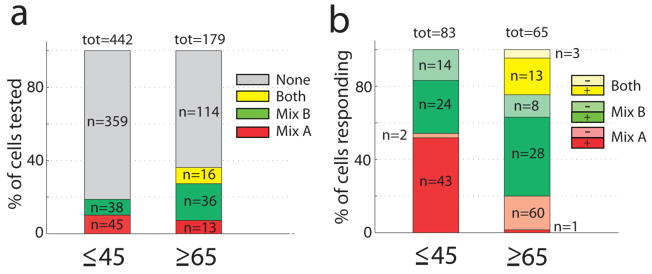
Fig. 4.
Selectivity and polarity of recorded OSN calcium responses to odor mixtures A and B. (a) The percentage of responsive cells was higher in OSNs from older donors, and a subset of cells from the older subjects responded to both odor mixtures. (b) This panel shows the percent of cells responding with different polarities to odors A and B (or to both odors). “+” denotes an odor-induced increase in calcium while “−“ denotes an odor-induced decrease in calcium. The percentage of odor-induced decreases in calcium in responses to mix A was higher in cells from older donors.

