
Fig. 3.
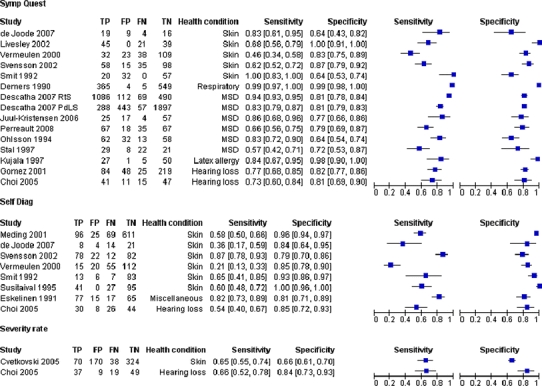
Forest plot of 19 included studies, categorized by type of self-report measure. TP true positive, FP false positive, FN false negative, TN true negative. Between the brackets the 95% confidence intervals (CI) of sensitivity and specificity. The figure shows the estimated sensitivity and specificity of the study (black square) and its 95% CI (black horizontal line)