
Figure 1.
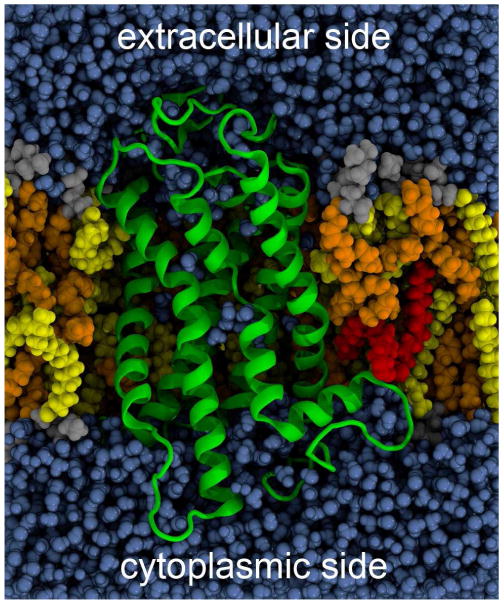
Snapshot of the MD simulation cell showing the composition of the system. The polypeptide backbone of rhodopsin is depicted in green with both lipid modifications shown in a van der Waals (vdW) representation in red. The lipid vdW surfaces are indicated with the head groups and glycerol backbone in grey, the DHA chains in orange, and the STEA chains in yellow. The extracellular side of the membrane is up and the cytoplasmic side is down. Note that one of the palmitoylations is in contact with the helix bundle and exhibits a kink leading to a chain upturn. The figure was prepared using VMD67.