
Figure 3.
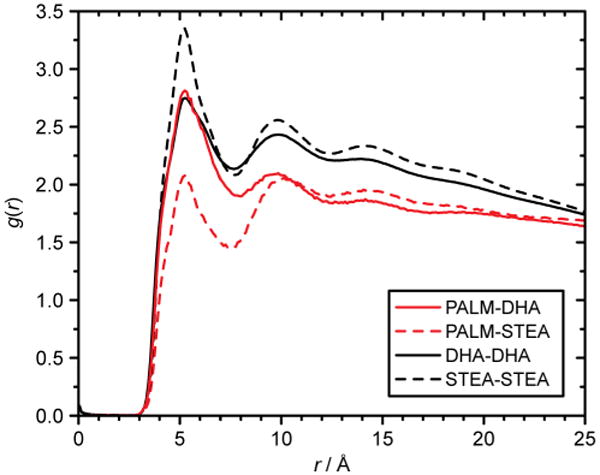
Radial pair distribution functions g(r) of both lipid modifications of rhodopsin with the individual DHA (red, solid line) and STEA (red, dashed line) chains. For comparison the RDFs for DHA chains with themselves (black, solid line) and STEA chains with themselves (black, dashed line) are also shown. When analyzing the direct neighbors of the palmitoylations (red lines) at small distances r significant differences are observed indicating they prefer DHA over STEA chains. Note that DHA (solid lines) is about as likely to have a palmitoyl chain (PALM) as its neighbor as another DHA chain. In contrast STEA (dashed lines) has many more STEA chains close to it than palmitoyl chains.