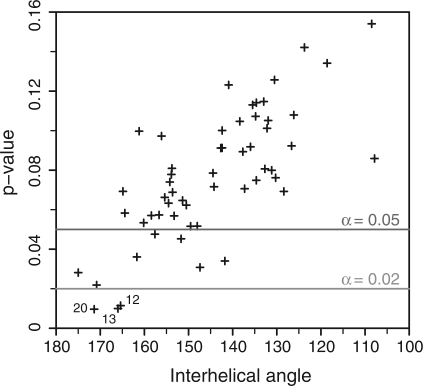
Figure 4.
Identification of SLI/SLV models compatible with the kinetic data. Plot of the P-value (Welch's t-test) against the mean interhelical angle. The P-value was obtained from a Welch's t-test that compared the rmsd distributions of the high-activity and low-activity classes of S/R pairs for a given common core group. The mean interhelical angle was obtained by computing the average interhelical angles of the 36 S/R pairs for each common-core group. All common-core groups showing a P-value < 0.02 are numbered. Standard deviations on the interhelical angles vary between 2° and 7°, but were omitted from the graph for clarity.

