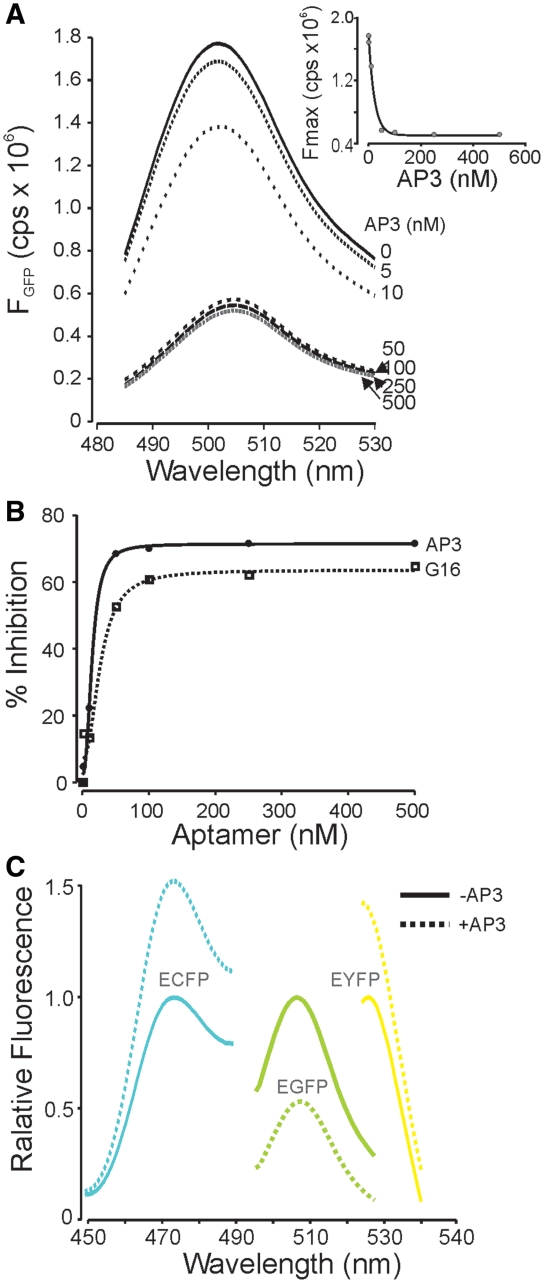
Figure 3.
FPBAs alter protein fluorescence. (A) Emission scan (475 nm excitation) of GFP in the presence of increasing concentrations of AP3. Inset shows dose-dependent inhibition of fluorescence at 505 nm; GFP concentration was 25 nM. No aptamers displayed measurable fluorescence and the original unselected aptamer pool did not alter GFP fluorescence (not shown). (B) Inhibition of GFP fluorescence by G16 and AP3 (475/505), showing higher affinity and greater maximum effect of AP3. (C) Fluorescence emission scans of enhanced FPs show the distinct functional effects of AP3. All spectra are normalized to peak fluorescence in the absence of AP3 and reflect 10 nM of FP and 250 nM AP3. Note increase in ECFP and EYFP fluorescence in the presence of AP3.

