Figure 4.
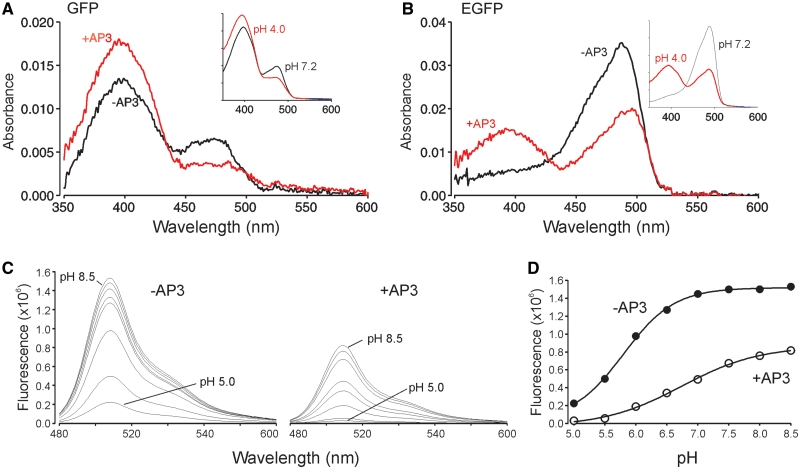
FPBAs alter flurorescent properties. (A) Absorbance spectrum of 200 nM GFP in the presence and absence of 5 µM AP3 at pH 7.4. Insert shows spectra of GFP (no AP3 present) taken at pH 7.2 and 4.0 for comparison. The fluorescence of GFP excited at 475 nm in the presence of AP3 was 30% (Figure 3B) of the GFP without AP3, whereas the pH 4 shift reduced the fluorescence intensity to 47% of the pH 7.2 value. (B) Absorbance spectrum of 400 nM EGFP in the presence and absence of 5 µM AP3 at pH 7.4. Insert shows spectra of EGFP (no AP3 present) taken at pH 7.2 and 4.0 for comparison. The fluorescence of EGFP excited at 475 nm in the presence of AP3 was 45% (Figure 3C) of the EGFP without AP3, whereas the shift to pH 4 reduced the fluorescence intensity by nearly an equal amount to 57% of the pH 7.2 value. (C) pH titration curves of EGFP without and with AP3 bound. (D) pKa of eGFP in the presence and absence of the AP3 aptamer. Respectively, pKa = 5.8 (−AP3) and pKa = 6.7 (+AP3).

