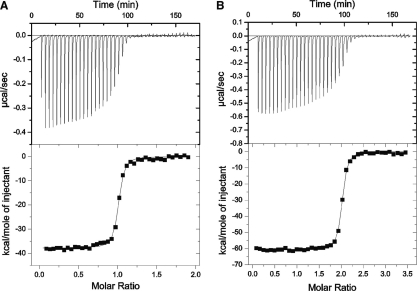
Figure 7.
Isothermal titration calorimetry of GFP–aptamer interactions. (A) Titration of GFP into aptamer AP3-1, the solid line in the bottom panel corresponds to ΔH = −37.82 kcal/mol, Kb = 1.98 × 10⁸ M−1, and N = 1. (B) Titration of GFP into dimeric AP3, the solid line in the bottom panel corresponds to ΔH = −56.5 kcal/mol, Kb = 3.16 × 108.M−1, and N = 2. Top panel of (A, B): raw data after baseline correction. Bottom panel of (A, B): integrated data corrected for the heat of dilution of the GFP. The solid line in the bottom panel represents the best fit to one-site binding model. Note the shift in titration of the dimer to a high molar ratio of GFP/aptamer.

