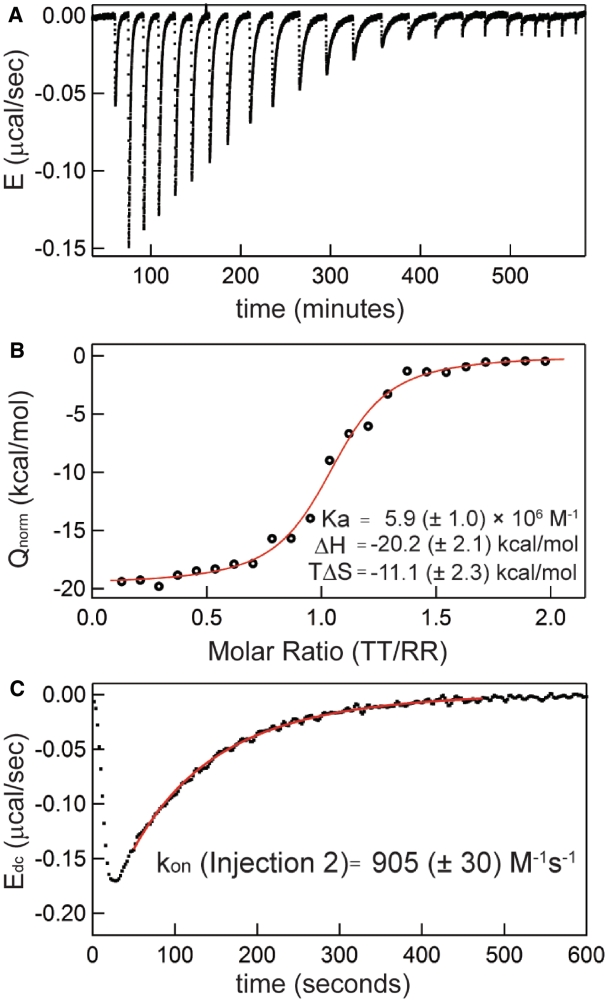
Figure 2.
Extraction of both thermodynamic and kinetic parameters from a single binding titration. Forward titration with titrant [TT] = 229 µM, starting cell [RR] = 10 µM, using 5 µL injections, at 20°C in 0.5 mM MgCl2 solution. (A) Raw power trace following baseline subtraction to present excess power [E = (∂Q/∂t)]. (B) Binding curve following integration of each peak to plot the concentration-normalized heat evolved (Qnorm) against the current molar ratio. Best fit parameters for the displayed dataset are listed. (C) Injection Peak 2 following deconvolution (Edc); best-fit curve and resulting kon value for the peak using fit methodology as described in ‘Materials and Methods’ section are provided.

