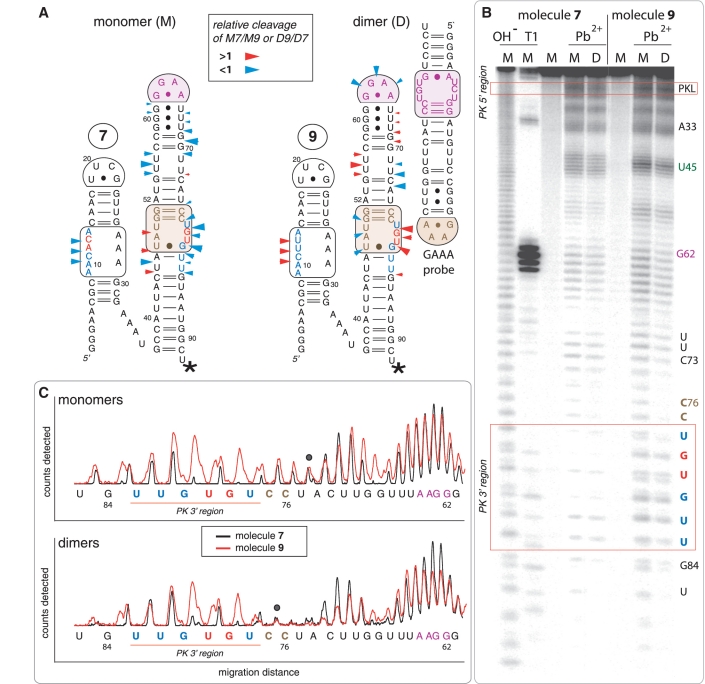
Figure 4.
Lead(II)-induced cleavage patterns for tectoRNA attenuators 7 and 9 in their monomeric and heterodimeric states. (A) 2D diagrams of tectoRNA attenuators with reported differential Pb(II) cleavage patterns in the monomeric (M) and heterodimeric (D) states. Phosphate positions in monomer 7 (M7) that show enhanced or reduced Pb(II) cleavage with respect to monomer 9 (M9) are indicated by red or blue arrows on the 2D diagram of 7, respectively. Phosphate positions in heterodimer 9 (D9) that show enhanced or reduced Pb(II) cleavage with respect to heterodimer 7 (D7) are indicated by red or blue arrows on the 2D diagram of 9, respectively. The size of the arrows is roughly proportionate to the difference in cleavage for M7 versus M9 or D9 versus D7. A star indicates the radiolabeled RNA 3′-end. (B) Pb(II) cleavage patterns of 32P radiolabeled molecules 7 and 9 either alone or bound to their non-radioactive cognate GAAA probe [as shown in (A)]. M and D correspond to monomer and dimer lanes, respectively. Cleavage experiments (indicated by Pb2+) were carried out as described in the Materials and Methods section; OH− indicates alkaline hydrolysis ladder; T1 indicates RNase T1 digestion. (C) Superposed lead cleavage profiles for monomers 7 and 9 (top) and for the corresponding heterodimers in presence of GAAA probe (bottom). Black dots indicate positions used for normalization. Similar results are obtained by comparing attenuators 7 and 8 (Supplementary Figure S3).

