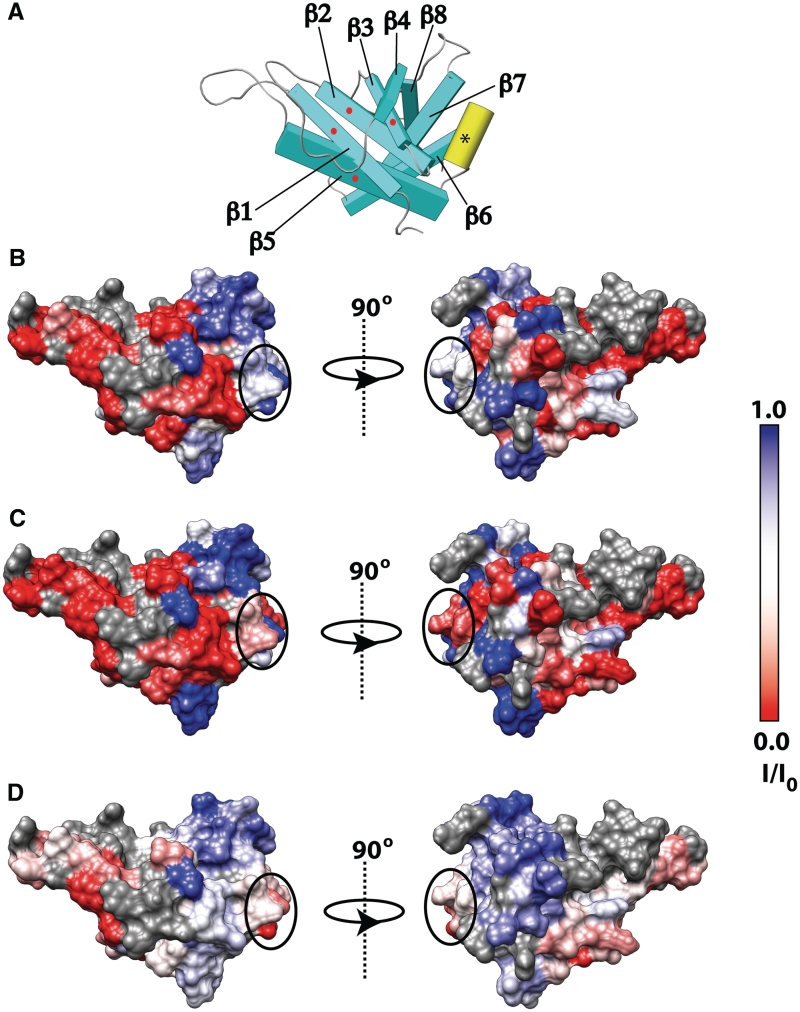
Figure 7.
(A) Schematic representation of PaePE showing the secondary structural elements in the same orientation as in the left panels of (B–D). The largest conformational changes in the presence of metal ions involve the face formed by the strands β1, β2, β3 and β5 (indicated by the red dots). Some weak binding is also seen in the α-helical segment [indicated by an asterisk, also circled in panels (b–d)]. Spectral perturbations in the presence of (b) Cd2+, (c) Zn2+ and (d) Mn2+ ions are mapped onto the PaePE surface. Reduction in peak intensity (I/I0) in 15N,1H HSQC spectra of PaePE in the presence of an equimolar ratio of metal ions is depicted using a red (maximum attenuation in the presence of metal with respect to the reference state) to blue (minimum attenuation) scale (also see Supplementary Figure S10). Residues for which perturbations could not be analyzed due to missing assignments, spectral overlap or weak peaks in the reference state are shown in gray. Note that the signal attenuation in the presence of Mn2+ is due to a combination of conformational changes and paramagnetic relaxation enhancement effects.

