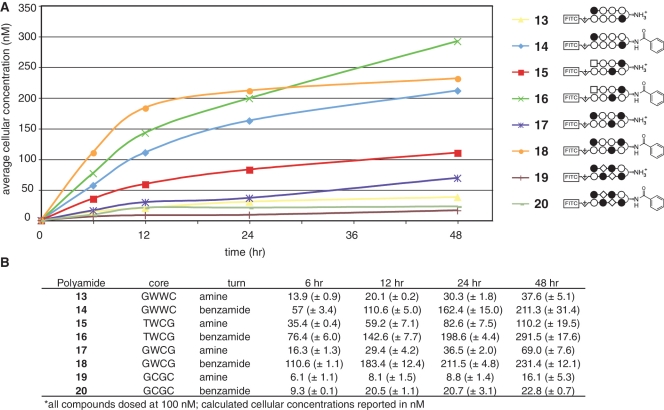
Figure 6.
Time course analysis of uptake of polyamide-FITC conjugates incorporating diverse DNA sequence-recognition elements. (A) Cellular concentration of polyamide-FITC conjugates 13–20 as a function of time incubated with A549 cells. Polyamide structures are represented as ball and stick models according the shorthand code: closed circle, Im monomer; open circle, Py monomer; diamond, β-alanine; square, 3-chlorothiophene 2-carboxylic acid. Complete structures can be found in Supplementary Data. Cellular concentration calculated from flow cytometry data as described in materials and methods. (B) Data displayed in tabular form with standard deviations. Core = DNA sequence targeted by the hairpin polyamide core heterocylic ring pairs. Turn = identity of β-turn modification.

