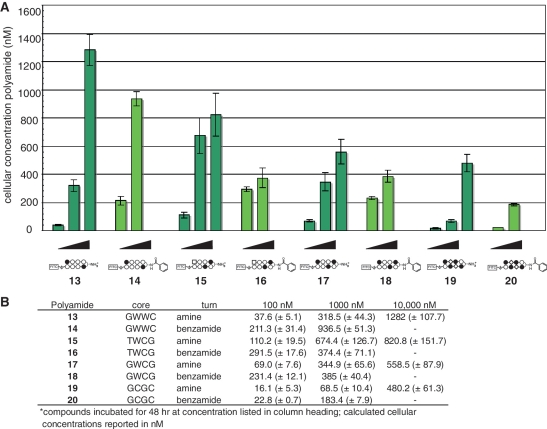
Figure 7.
Influence of polyamide dosage on cellular concentration at 48 h. (A) Graphical depiction of relative cellular concentrations of polyamides analyzed in this study. β-Amino polyamides 13, 15, 17 and 19 were dosed at 100, 1000 and 10 000 nM, respectively (left to right). β-Aryl polyamides 14, 16, 18 and 20 were dosed at 100 and 1000 nM, respectively (left to right). Attempts to dose β-aryl compounds at higher concentrations were hindered by insolubility. Cellular concentration calculated from flow cytometry data as described in materials and methods. (B) Data displayed in tabular form with standard deviations. Core = DNA sequence targeted by the hairpin polyamide core heterocylic ring pairs. Turn = identity of β-turn modification.

