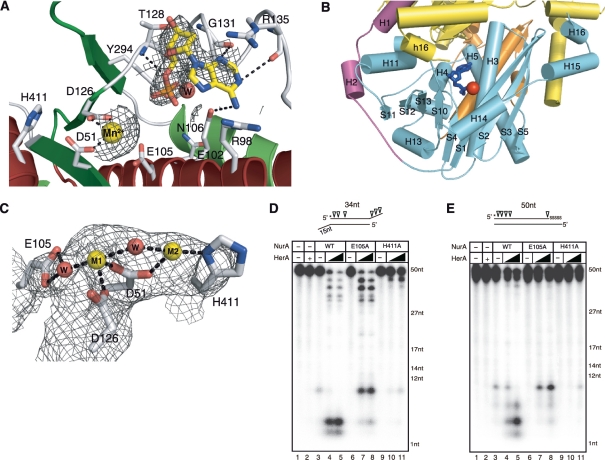
Figure 4.
Active site of PfNurA. (A) 2FO–FC electron density map (1.2σ) showing dAMP, Mn2+ and the interacting residues. H-bonds and ion pairs are shown as dotted lines. (B) An active site cleft. An active site cleft with a Mn2+ ion (red sphere) and dAMP (blue stick). The C-terminal end of another PfNurA monomer (yellow) is directed toward the active site cleft of the PfNurA monomer. The three domains are colored as in Figure 2B. (C) 2FO–FC electron density map (1.5σ) of two Mn2+ ions. Active site residues and water molecules are shown. H-bonds and ion pairs are shown as dotted lines. (D) Nuclease activity analysis of the two active site mutant proteins. TP 424/423 or (E) TP 580/124 was used as the substrate. Assay conditions were the same as those used in Figure 1B.

