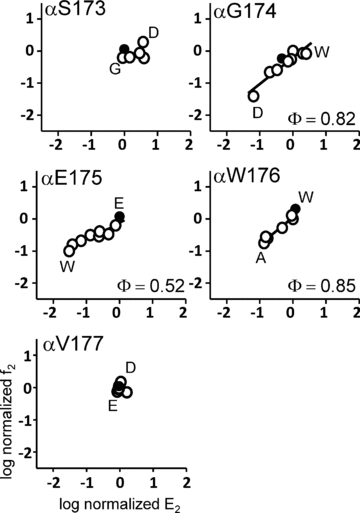
Figure 2. Rate–equilibrium (R–E) plots for mutations of loop 9 in the α subunit.

f2 is the forward, channel-opening rate constant (s−1) and E2 is the diliganded gating equilibrium constant. Values have been normalized by the wt value (filled circles). In each panel, the x-axis range reflects the mutational sensitivity of the position with regard to E2. Only positions 174, 175 and 176 show significant changes in gating upon mutation.
