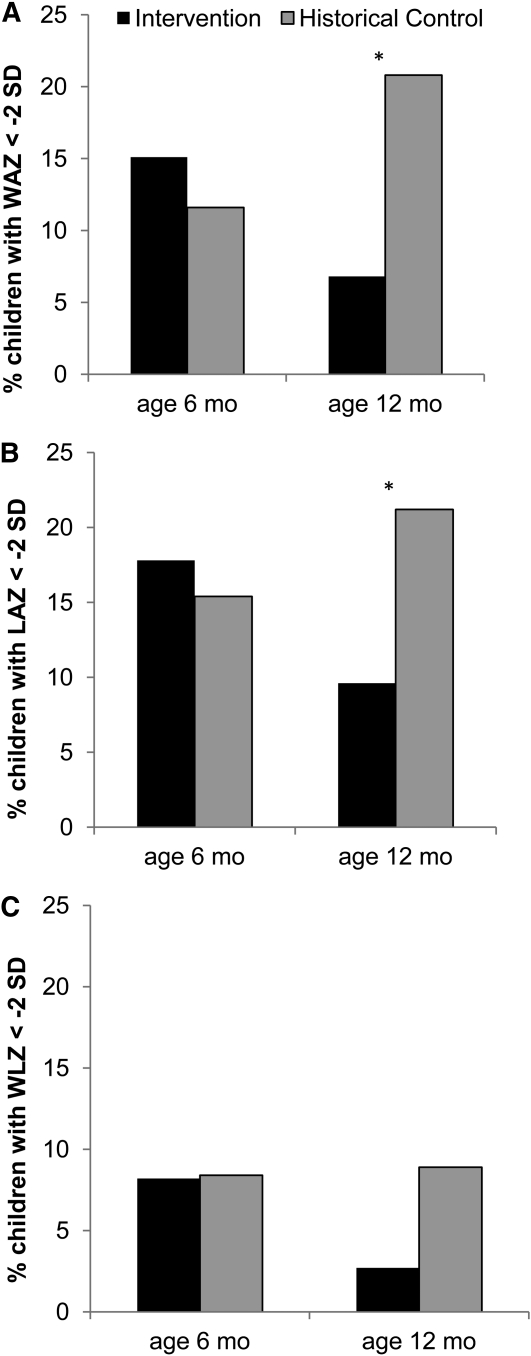
FIGURE 1.
Prevalence of HIV-exposed children being underweight (A), stunted (B), or wasted (C) in intervention and historical control groups at 6 and 12 mo of age. Intervention group, n = 73. Historical control at age 6 mo, n = 138 and at age 12 mo, n = 219. Age range of children at age 6 mo was 5.5–6.76 mo and at 12 mo was 11.0–12.25 mo. *Groups differ, P < 0.05.

