
Figure 3.
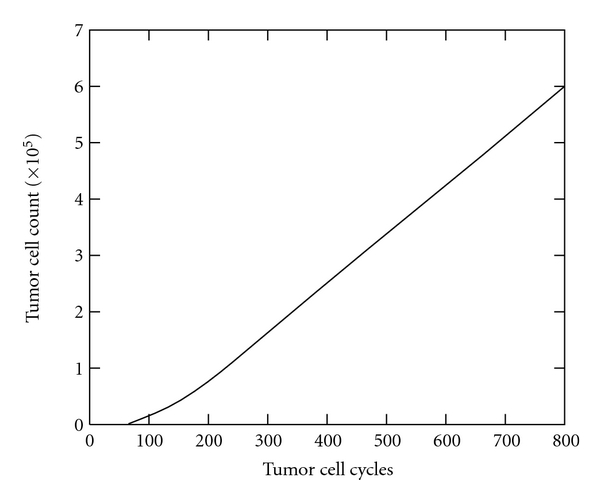
An example of growth curve produced by the Mallet and de Pillis in silico model showing total number of tumor cells over time for a tumor growing in the absence of immune response.
Official websites use .gov
A
.gov website belongs to an official
government organization in the United States.
Secure .gov websites use HTTPS
A lock (
) or https:// means you've safely
connected to the .gov website. Share sensitive
information only on official, secure websites.
An example of growth curve produced by the Mallet and de Pillis in silico model showing total number of tumor cells over time for a tumor growing in the absence of immune response.