
Figure 4.
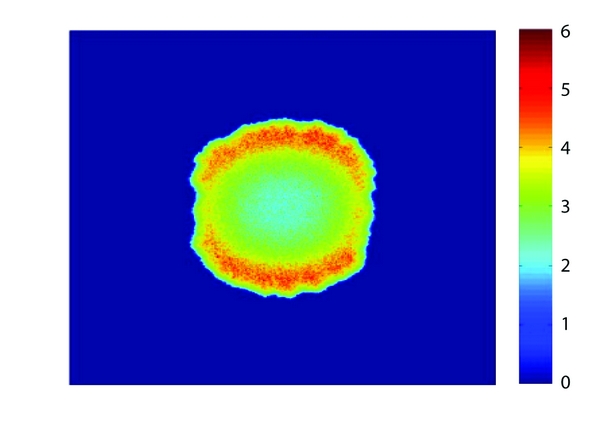
An example of two-dimensional tumor growth after 800 cell cycles, simulated using the Mallet and de Pillis in silico model. Red intensity indicates tumor cell density. The domain shown is approximately 10–20 mm square, and growth is over a time period of at least a year.