
Figure 6.
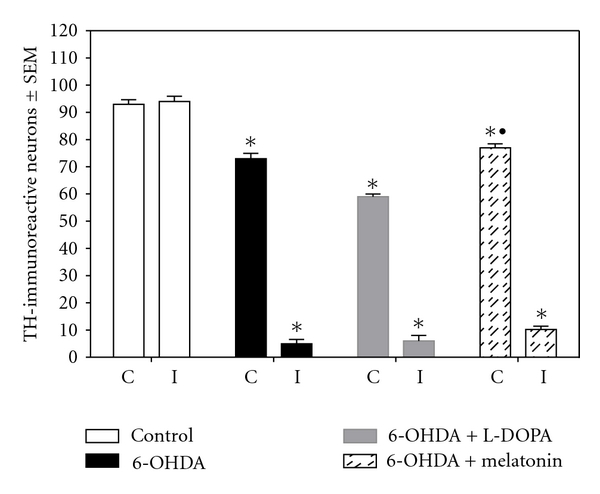
TH-immunoreactive cell counts from the SNc. The data are presented as the mean ± SEM. A statistically significant decrease in TH-immunoreactive cells was detected in both ipsilateral (I) and contralateral (C) SNc in the three experimental groups ( ∗ P < 0.05 versus control group; • P < 0.05 between melatonin and 6-OHDA and LD-treated groups; ANOVA test).