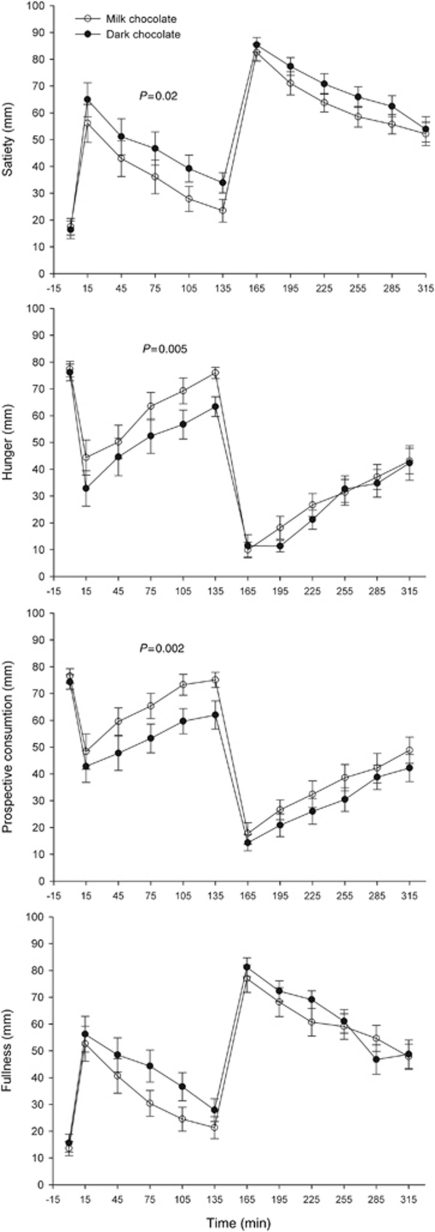
Figure 2.
Mean satiety, hunger, prospective consumption and fullness VAS scores (±s.e.m.) during the two test days, n=16. The chocolate was served at 0 min and the ad libitum meal at 135 min. The P-values were obtained from repeated-measures analysis of covariance testing differences between postprandial appetite scores (15–135 min)—baseline values were included as covariates.

