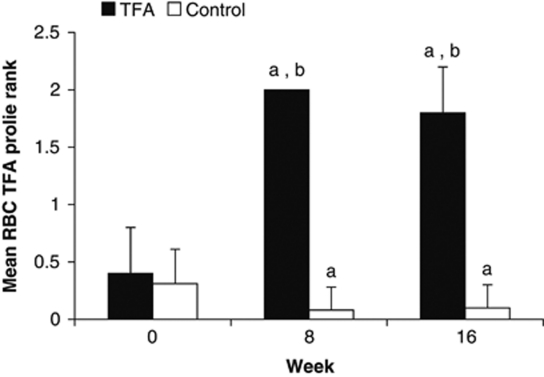
Figure 2.
Semi-quantitative assessment of trans fatty acids (TFAs) in red blood cell (RBC) phospholipids assessed by gas chromatography. Based on semi-quantitative assessments of RBC trans18:1 profiles, including the scores 0, 0.5, 1, 1.5 and 2 (where 2 signifies full enrichment) (Supplementary Figure 1), maximal TFA enrichment was observed by week 8 and was generally sustained at week 16 in the TFA group (n=24), whereas the subjects in the control group experienced no TFA enrichment (n=25). Changes from baseline TFA profiles were assessed by repeated-measures ANOVA. Owing to the non-normal distribution of the semi-quantitative data, the analyses were performed on ranked data. aSignificantly different from the baseline value (P<0.001). bSignificantly different from the control group (P<0.001).

