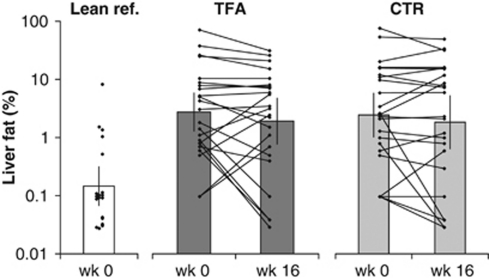
Figure 4.
Liver fat percentage in the trans fat group (TFA; n=23) and in the control group (CTR; n=23) before and after 16 weeks of dietary intervention and in lean references (n=19) obtained by 1H MR spectroscopy. Bars show geometric means (95% confidence intervals). There was no significant effect of diet, P=0.87 for differences between diet groups at week 16 with week 0 as a covariate, by analysis of covariance performed on log-transformed data. The liver fat % in lean references was significantly lower than in overweight intervention subjects (diet groups combined) by Kruskal–Wallis test for skewed data; P<0.01.

