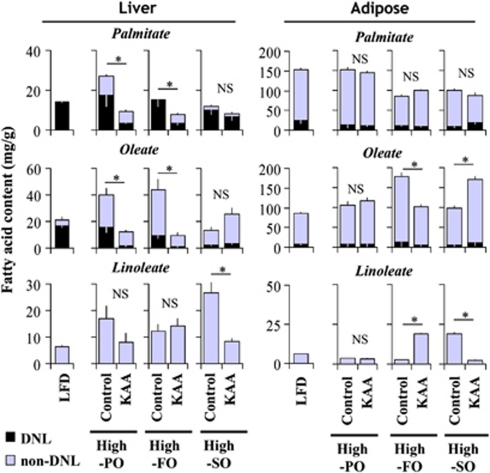
Figure 5.
Fatty sources for hepatic and adipose trigylyceride in C57B6 mice fed different diets. Metabolic flux of DNL was analyzed by identifying fatty sources for hepatic (left panels) and adipose (right panels) triglycerides using deuterated water labeling and mass isotopomer distribution analysis (see Materials and methods section). The contribution of DNL to total triglyceride fatty acids in both tissues was separately estimated for palmitate (c16:0) and oleate (c18:1); only non-DNL values are shown for linoleate (18:2). Black and blue bars represent DNL and non-DNL sources, respectively. All values are expressed as means±s.e.m. (n=6 for each group). *P<0.05 for all HFD control groups as compared with the LFD group or as indicated.

