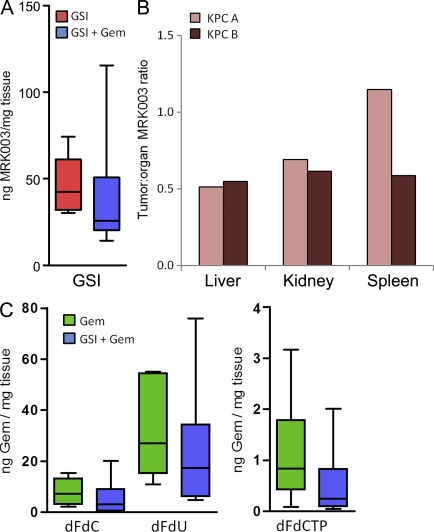
Figure 2.
Intratumoral measurements of MRK003 and gemcitabine and tumor volumes. (A) Concentration of MRK003 in PDA tissue after monotherapy (n = 6) and GSI/gemcitabine combination treatment (n = 6; P = 0.18). (B) Ratio of MRK003 in other organs compared with the amount in a tumor in two different mice. (C) Concentration of gemcitabine and its metabolites in whole tumor samples (n = 6 on all cohorts). All animals were treated for 10 d then sacrificed 1 h after the last dose of gemcitabine and 6 h after the last dose of MRK003. Error bars represent SEM.

