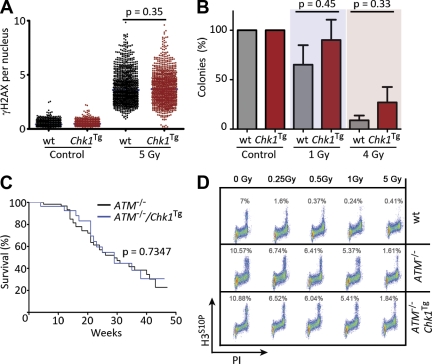
Figure 4.
Chk1Tg does not rescue ATM deficiency. (A) HTM-mediated quantification of γH2AX in WT and Chk1Tg MEF exposed to 5 Gy of IR for 1 h. Data are representative of three independent experiments. (B) Number of colonies per plate in WT and Chk1Tg MEF after exposure to 1 or 4 Gy of IR (normalized to the number of colonies found in control plates). The experiment was repeated twice with two independent MEF pairs. (C) Kaplan-Meyer curves of ATM−/− (n = 39) and ATM−/−/Chk1Tg (n = 26) mice. The p-value was calculated with the Mantel-Cox log-rank test. (D) Activation of the IR-induced G2/M checkpoint in WT, ATM−/−, and ATM−/−/Chk1Tg cells. Images are representative of two independent experiments. In A, center lines indicate mean values; in B, error bars indicate SD.

