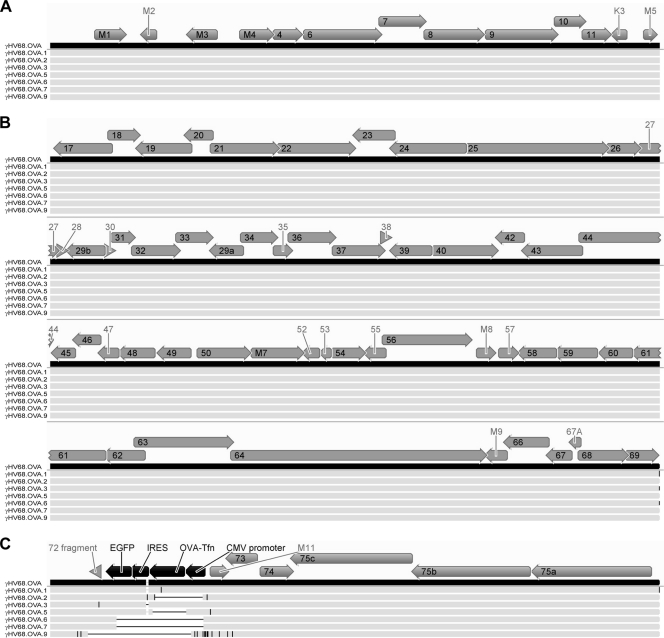
Fig 4.
Mutations in the new viral isolates are confined to the OVA locus. The schematic shows multiple sequence alignments of γHV68.OVA (black bar) and the seven viral isolates that were fully sequenced (light gray bars). The figure shows (A) the left end of the genomes up to the 40-bp repeat region, (B) the middle of the genomes between the 40-bp and 100-bp repeat regions, and (C) the right end of the genomes from the 100-bp repeat region onward. γHV68 ORFs are represented by gray arrows; ORFs and other features of the OVA expression cassette are represented by black arrows. ORF labels that did not fit within their respective arrows are shown outside the arrows. Deletions relative to the γHV68.OVA sequence are represented by horizontal black lines, while insertions and nucleotide changes relative to the γHV68.OVA sequence are represented by vertical black lines. Due to the compression of the genome sequences, mutations that are close together may appear as single horizontal or vertical black lines in this schematic. Briefly, genomic DNA for each virus was prepared as previously described (25) and sequenced on the 454 GS-FLX platform (454 Life Sciences) according to the manufacturer's instructions. For each virus, randomly selected sets containing different numbers of sequence reads were assembled using Newbler as previously described (16) and the largest contig generated is reported here. The estimated fold coverage for each assembled genome was as follows: for γHV68.OVA.1, 42-fold; for γHV68.OVA.2, 53-fold; for γHV68.OVA.3, 52-fold; for γHV68.OVA.5, 41-fold; for γHV68.OVA.6, 12-fold; for γHV68.OVA.7, 11-fold; and for γHV68.OVA.9, 10-fold. All sequence alignments were generated using Geneious software (Biomatters Ltd., Auckland, New Zealand).

