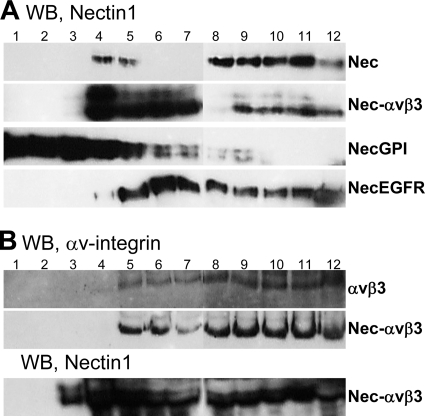
Fig 2.
Floatation of membranes from cells expressing nectin1 alone or in combination with αVβ3-integrin. 293T cells overexpressing nectin1 alone (Nec), αVβ3-integrin alone (αVβ3), nectin1 plus αVβ3-integrin (Nec-αVβ3), nectin1-GPI (NecGPI), or nectin1-EGFR (necEGFR) were solubilized in TNE buffer (10 mM Tris-HCl, 150 mM NaCl, 5 mM EDTA, 1% Triton X-100, 0.036 mg/ml of each of the protease inhibitors Nα-p-tosyl-l-lysine chloromethyl ketone [TLCK; Sigma-Aldrich] and N-tosyl-l-phenylalanine chloromethyl ketone [TPCK; Sigma-Aldrich]) and layered at the bottom of a preformed 5%–35%–42% sucrose gradient, as detailed in reference 10. After centrifugation at 200,000 × g for 20 h at 4°C in a SW41 swing-out rotor, 12 fractions (1 ml) were collected from the top. Aliquots from each fraction were subjected to sodium dodecyl sulfate-polyacrylamide gel electrophoresis (SDS-PAGE). nectin1 was visualized by Western blotting (WB) with CK6 monoclonal antibody (MAb; Santa Cruz Biotechnologies) directed to the ectodomain, followed by peroxidase-conjugated anti-mouse antibody and enhanced chemiluminescence (ECL). For panel B, samples were denatured in the absence of β-mercaptoethanol to enable integrin visualization by polyclonal antibody (PAb) 1930 (Chemicon, Milan, Italy) to αV-integrin. Numbers indicate the numbers of the fractions.

