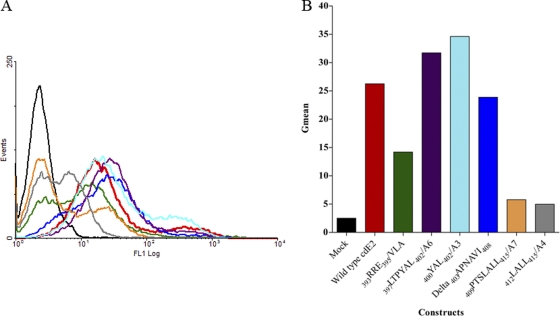
Fig 3.
Analysis of the cell surface expression of E2. (A) BHK-15 cells were electroporated with in vitro-transcribed RNA from wild-type or mutant clones as described. At 12 h posttransfection, the cells were harvested and stained with rabbit polyclonal anti-E2 antibody and a fluorescein-conjugated secondary antibody and analyzed in a FACSCalibur flow cytometer. The black curve represents the signal from mock-transfected cells and red from the wild-type RNA-transfected cells. All the other curves show a shift from the mock and represent the expression of E2 at the cell surface. (B) Graphical representation of the geometric mean of the region of the curve measuring the amount of E2 fluorescence of each cdE2 mutant at the plasma membrane.

