Fig 3.
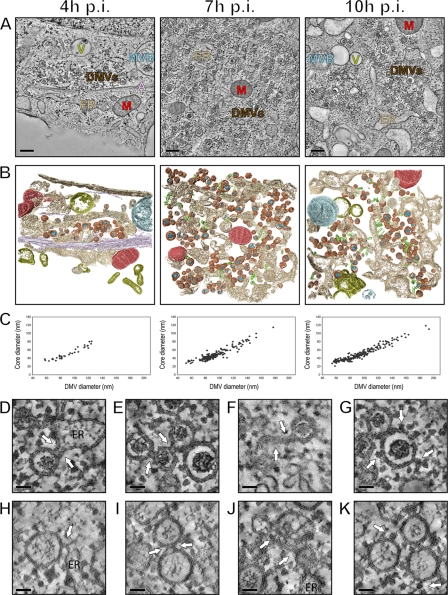
Electron tomography of cytoplasmic areas containing EAV-induced DMVs. (A) EAV-infected Vero E6 cells were high-pressure frozen at 4, 7, and 10 h p.i. and processed for dual-axis electron tomography to obtain 3-D reconstructions of relevant cytoplasmic areas. The images show a 10-nm slice through the tomographic reconstruction of 200-nm-thick resin-embedded sections. Along with DMVs (brown), cores (blue), ER (beige), EAV tubules (green), mitochondria (M; red), smooth-walled vesicles (V; yellow), multivesicular body (MVB; blue-gray), and actin filaments (A; purple) are depicted. Scale bars, 500 nm. (B) 3-D surface-rendered models of the tomograms that were derived from panel A. The models illustrate the relative abundances of DMVs at different time points, the clustering of DMVs, and the cytoplasmic content near the vesicles. The same coloring scheme as in panel A was used to show the different organelles. (C) All DMVs within the tomograms, acquired at 4 (n = 34), 7 (n = 193), and 10 h p.i. (n = 194) and shown in panel B, were delimited in silico, counted, and measured in the x and y directions to derive average diameters of the complete DMV and the DMV core. If the equator of an individual DMV was present within the tomogram volume, a subvolume of 250 (x) by 250 (y) by 10 (z) pixels was extracted from the central part of the DMV and merged into a single image representing a 12-nm-thick section through the middle of the DMV. The graph shows the correlation between the average (x, y) diameter of individual DMVs (x axis) and the corresponding average (x, y) diameter of the DMV cores (y axis). (D to G) Close-ups of the tomograms shown in panel A. The arrows indicate connections of DMV outer membranes with the ER (D), other DMVs (E), and curved double-membrane structures (F). Ribosomes were found to decorate the surface of the outer DMV membrane (G, arrows). (H to K) Close-ups of structures comparable to those in panels D to G but derived from plunge frozen samples exhibiting alternative staining and contrast of membrane structures. Scale bars, 50 nm.

