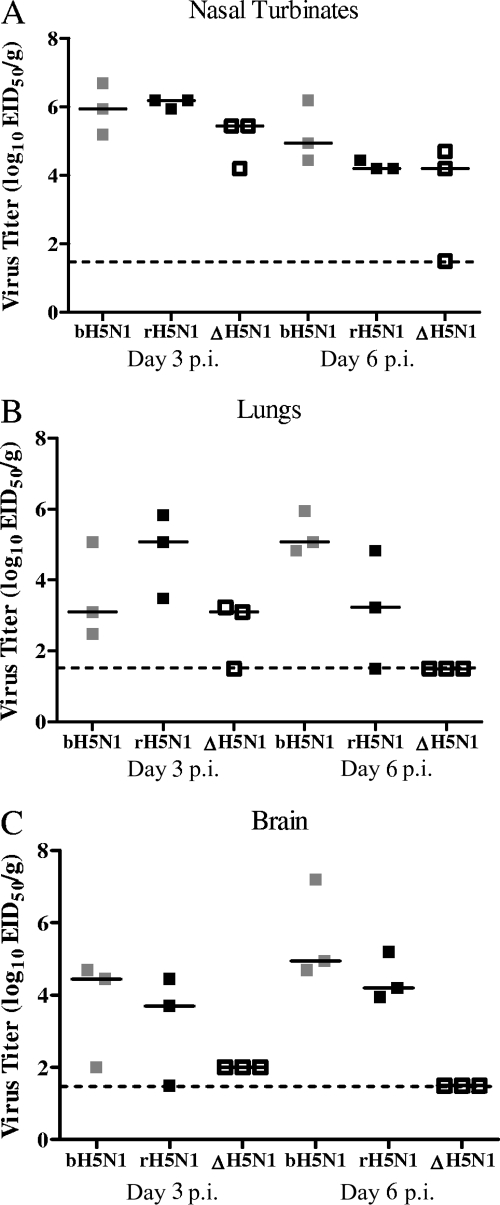
Fig 5.
The H5N1 virus replicated in the respiratory tract and brain of ferrets. Groups of ferrets (n = 4/group) were infected with 106 TCID50 of either bH5N1 (gray squares), rH5N1 (black squares), or ΔH5N1 virus (white squares) i.n., each symbol representing a discrete data point in each group. Nasal turbinates (A), lungs (B), and the brain (C) were harvested on days 3 and 6 p.i. Horizontal bars represent the median virus titer, expressed as log10 TCID50/g of tissue.

