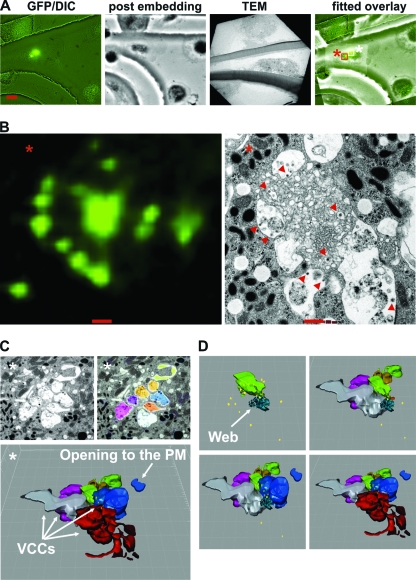
Fig 6.
Three-dimensional reconstruction of macrophage internal HIV-1 accumulations. (A) Relocation of an HIV-1 GG-infected macrophage by correlative microscopy. Fluorescence images of infected macrophages grown on a culture dish with a grid were taken to relocate the infected macrophage by TEM 7 dpi. The scale bar shows a distance of 10 μm. (B) Magnification of the area of Gag accumulations, marked with a red square and an asterisk in panel A, and the ultrastructure of this specific region by TEM. Some viral particles are marked with a red arrowhead. The scale bar indicates a distance of 500 nm. (C) 3-D reconstruction of the serial sections displayed in Fig. S4 in the supplemental material. Imaris 6.4.2 (Bitplane) was used to reconstruct the colored vacuoles surrounding the central membranous web region (see also Movie S3 in the supplemental material). Viral particles are depicted as yellow dots. One large VCC, colored in blue, ends up toward a microvillus-enriched region. (D) The membrane web in light green and turquoise (first picture) is surrounded by VCCs. Viral particles (yellow dots) are present inside (see Movie S4 in the supplemental material). Similar structures corresponding to Gag accumulations were observed in two additional macrophages from this donor and in two macrophages from independent donors. We never found comparable structures in uninfected macrophages from the same donors.

