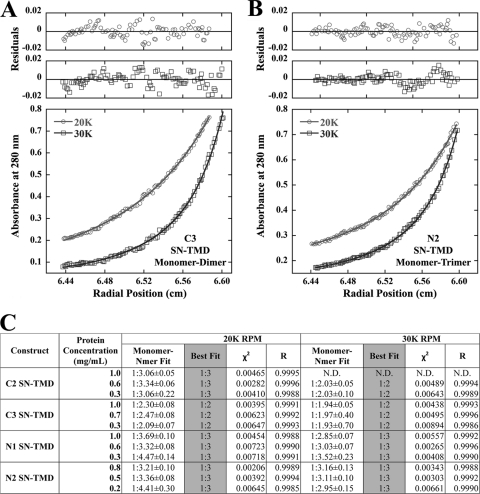
Fig 4.
C-terminal insertions disrupt TMD-TMD interactions. (A) SE analysis of the C3 SN-TMD construct showing the residuals and curve at 20,000 and 30,000 rpm for one concentration fit to a monomer-dimer model. (B) SE analysis of the N2 SN-TMD construct fit to a monomer-trimer model. (C) Additional SN-TMD constructs and fit statistics, including monomer–N-mer fits (± standard error), for different rotor speeds and protein concentrations.

