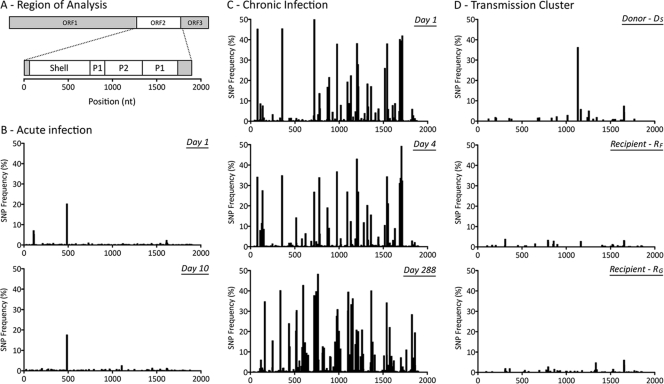
Fig 2.
Distribution of single nucleotide polymorphisms (SNPs) detected from the 3′ end of ORF1 to the 5′ end of ORF3. (A) The NoV genomic region analyzed and domains of interest within ORF2, which are shown across the x axes of panels B to D. (B) Distribution of SNPs for subject Ac (acute infection), measured 9 days apart. (C) Distribution of SNPs for subject Ch (chronic infection) at days 1, 4, and 288. (D) Distribution of SNPs for the transmission cluster, involving three acutely infected family members. The donor (subject DS) transmitted the virus to two recipients, subjects RF and RG. A single sample was collected from each infected subject at each time point during the acute stage. The distribution of SNPs, portrayed as a percentage of the viral population, indicates that intrahost viral populations were homogenous for the four acutely infected subjects, with only a few prevalent SNPs (>10%) (B and D). In contrast, subject Ch (C) presented a heterogeneous intrahost population over the course of the infection. Multiple SNPs with a frequency of >10% in the viral population were distributed across the entire length analyzed.

