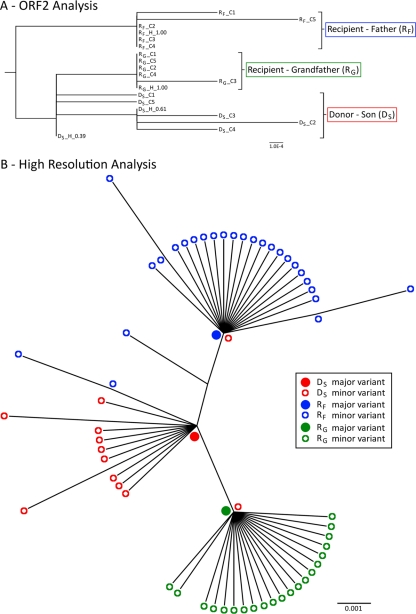
Fig 3.
Phylogenetic analysis of sequences from the NoV transmission cluster. (A) Phylogenetic tree of the full-length ORF2 sequences generated from reassembled short NGS reads and from cloning. Sequences are labeled first by their subject name, followed by whether they were generated by cloning (C) or NGS haplotype reconstructions (H). The haplotype frequency is also included at the end of the name. In this cluster, the donor (subject DS) had two closely related variants that were present at high frequencies (38 and 61%) and were identified by both NGS and cloning. However, neither of these two donor variants were found in the viral populations of the two recipients, and each subject's sequences clustered separately. The distance scale represents the number of nucleotide substitutions per position. (B) High-resolution phylogenetic analysis of a region spanning the 3′-terminal 171 nucleotides of ORF2 to the 5′-terminal 133 nucleotides of ORF3. This analysis was performed with NGS data and revealed substantial interhost diversity. For each subject (subjects DS, RF, and RG), the major variant was located at the node of the branch, with minor variants branching from it, indicating that the minor variants had evolved from the dominant variant. In addition, each recipient's major variant was found to be identical to a unique minor variant (<0.01%) isolated from the donor (subject DS). The donor's major variant was not identified in any of the recipient variants at frequencies as low as 0.01%. Filled circles represent major variants within a population, and open circles represent minor variants. Red indicates the donor son (subject DS), while blue represents the recipient father (subject RF) and green represents the recipient grandfather (subject RG). The distance scale represents the number of nucleotide substitutions per position.

